Silverlight4でグラフを描く(円グラフ、折れ線グラフ、散布図、バブルチャート)
再び、Silverlight4 でグラフを書いてみようと思います。今回は、円グラフを描いていきます。
開発環境は、Visual Studio 2010(評価版)です。Silverlight4 SDKやSilverlight4 Toolkitはインストールされていることを前提とします。
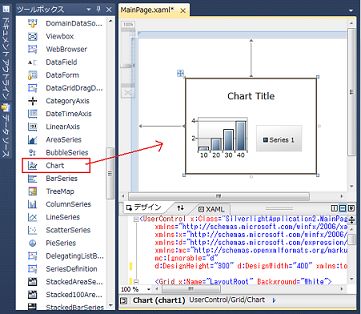
Silverlight4 Toolkitのインストール方法やVisual Studio 2010でグラフを描く基本的な操作方法については、以下のURL(前回の記事)を参照ください。
http://d.hatena.ne.jp/s-kita/20100725/1280069538
1.円グラフを描く
ここでは、例として「製品毎の売上シェア」を円グラフで表現したいと思います。
//製品の売上シェアを表すクラス
public sealed class ProductShare
{
    public String Name { get; set; }         //製品名
    public Int32 Share { get; set; }         //シェア(パーセント)
}public partial class MainPage : UserControl
{
public MainPage()
{
InitializeComponent();
List<ProductShare> l = new List<ProductShare>();
l.Add(new ProductShare { Name = "製品A", Share = 60 });//製品Aはシェア60%
l.Add(new ProductShare { Name = "製品B", Share = 30 });//製品Bはシェア30%
l.Add(new ProductShare { Name = "製品C", Share = 10 });//製品Cはシェア10%
this.chart1.DataContext = l;
}
}1-3, 1-4 をまとめると、MainPage.xaml.cs は以下のようになる
「MainPage.xaml.cs」
using System;
using System.Collections.Generic;
using System.Linq;
using System.Net;
using System.Windows;
using System.Windows.Controls;
using System.Windows.Documents;
using System.Windows.Input;
using System.Windows.Media;
using System.Windows.Media.Animation;
using System.Windows.Shapes;
namespace SilverlightApplication1
{
public partial class MainPage : UserControl
{
    public MainPage()
    {
        InitializeComponent();

        List<ProductShare> l = new List<ProductShare>();
        l.Add(new ProductShare { Name = "製品A", Share = 60 });//製品Aはシェア60%
        l.Add(new ProductShare { Name = "製品B", Share = 30 });//製品Bはシェア30%
        l.Add(new ProductShare { Name = "製品C", Share = 10 });//製品Cはシェア10%

        this.chart1.DataContext = l;
    }
}
//製品の売上シェアを表すクラス
public sealed class ProductShare
{
public String Name { get; set; } //製品名
public Int32 Share { get; set; } //シェア(パーセント)
}
}円グラフを描くためには、以下の3点に注意する必要がある。
・1. 円グラフを描くためにには、PieSeriesクラスを用いる。
・2. PieSeriesクラスのIndependentValueBindingプロパティにProductShareクラスのNameプロパティをバインドする
・3. PieSeriesクラスのDependentValueBindingプロパティにProductShareクラスのShareプロパティをバインドする
MainPage.xamlは、以下のようになる。
<UserControl x:Class="SilverlightApplication1.MainPage"
    xmlns="http://schemas.microsoft.com/winfx/2006/xaml/presentation"
    xmlns:x="http://schemas.microsoft.com/winfx/2006/xaml"
    xmlns:d="http://schemas.microsoft.com/expression/blend/2008"
    xmlns:mc="http://schemas.openxmlformats.org/markup-compatibility/2006"
    mc:Ignorable="d"
    d:DesignHeight="300" d:DesignWidth="400" xmlns:toolkit="http://schemas.microsoft.com/winfx/2006/xaml/presentation/toolkit">

    <Grid x:Name="LayoutRoot" Background="White">

        <toolkit:Chart Name="chart1" Title="Chart Title">
            <toolkit:PieSeries ItemsSource="{Binding}"
                               IndependentValueBinding="{Binding Name}"
                               DependentValueBinding="{Binding Share}"
                               Name="pieSeries1" />
        </toolkit:Chart>

    </Grid>
</UserControl>円グラフを描くことができた。
2. 折れ線グラフを描く
次に、折れ線グラフを書いてみます。円グラフで作成したSilverlightアプリケーションの続きからスタートします。
public sealed class QuarterlySales
{
    public String Quarter { get; set; } //クオーター
    public Int32 Sales { get; set; }    //売上高
}public partial class MainPage : UserControl
{
public MainPage()
{
InitializeComponent();
List<QuarterlySales> l = new List<QuarterlySales>();
l.Add(new QuarterlySales { Quarter = "1st", Sales = 500 });
l.Add(new QuarterlySales { Quarter = "2nd", Sales = 600 });
l.Add(new QuarterlySales { Quarter = "3rd", Sales = 900 });
l.Add(new QuarterlySales { Quarter = "4th", Sales = 800 });
this.chart1.DataContext = l;
}
}まとめると、MainPage.xaml.cs は以下のようになる
using System;
using System.Collections.Generic;
using System.Linq;
using System.Net;
using System.Windows;
using System.Windows.Controls;
using System.Windows.Documents;
using System.Windows.Input;
using System.Windows.Media;
using System.Windows.Media.Animation;
using System.Windows.Shapes;
namespace SilverlightApplication1
{
public partial class MainPage : UserControl
{
    public MainPage()
    {
        InitializeComponent();

        List<QuarterlySales> l = new List<QuarterlySales>();
        l.Add(new QuarterlySales { Quarter = "1st", Sales = 500 });
        l.Add(new QuarterlySales { Quarter = "2nd", Sales = 600 });
        l.Add(new QuarterlySales { Quarter = "3rd", Sales = 900 });
        l.Add(new QuarterlySales { Quarter = "4th", Sales = 800 });

        this.chart1.DataContext = l;
    }
}
public sealed class QuarterlySales
{
public String Quarter { get; set; } //クオーター
public Int32 Sales { get; set; } //売上高
}
}・折れ線グラフは、LineSeriesクラスで実現する。
・やはり、IndependentValueBindingには、X軸に相当するQuarterlySalesクラスのQuarterプロパティをバインドする
・同様に、DependentValueBindingには、Y軸に相当するQuarterlySalesクラスのSalesプロパティをバインドする
MainPage.xamlは、以下のようになる
<UserControl x:Class="SilverlightApplication1.MainPage"
    xmlns="http://schemas.microsoft.com/winfx/2006/xaml/presentation"
    xmlns:x="http://schemas.microsoft.com/winfx/2006/xaml"
    xmlns:d="http://schemas.microsoft.com/expression/blend/2008"
    xmlns:mc="http://schemas.openxmlformats.org/markup-compatibility/2006"
    mc:Ignorable="d"
    d:DesignHeight="300" d:DesignWidth="400" xmlns:toolkit="http://schemas.microsoft.com/winfx/2006/xaml/presentation/toolkit">

    <Grid x:Name="LayoutRoot" Background="White">

        <toolkit:Chart Name="chart1" Title="Chart Title">

            <toolkit:LineSeries
                ItemsSource="{Binding}"
                IndependentValueBinding="{Binding Quarter}"
                DependentValueBinding="{Binding Sales}"
                Title="売上高"/>

        </toolkit:Chart>

    </Grid>
</UserControl>折れ線グラフを描くことができた
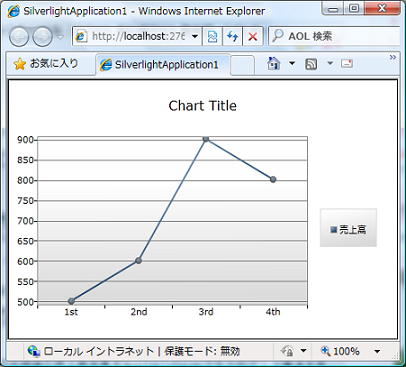
しかし、これでは複数の系列を表示させて比較することができない。この要求を満たせるように修正してみます。
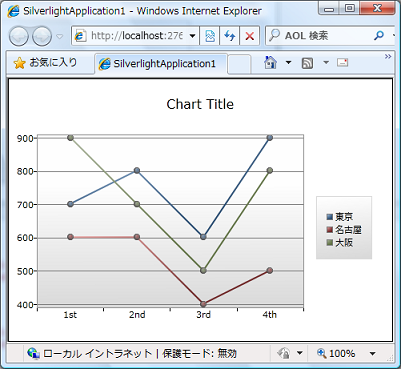
複数の系列を表示させる例として、東京、名古屋、大阪の各支店毎に四半期ごとの売上高をグラフにしてみたいと思います。
MainPage.xaml.csにて、各四半期に対する東京、名古屋、大阪の売上高を表すようにプロパティを修正する
public sealed class QuarterlySales
{
    public String Quarter { get; set; } //クオーター
    public Int32 Tokyo { get; set; }    //東京の売上高
    public Int32 Nagoya { get; set; }   //名古屋の売上高
    public Int32 Osaka { get; set; }    //大阪の売上高
}public partial class MainPage : UserControl
{
public MainPage()
{
InitializeComponent();
List<QuarterlySales> l = new List<QuarterlySales>();
l.Add(new QuarterlySales { Quarter = "1st", Tokyo = 700, Nagoya = 600, Osaka = 900 });
l.Add(new QuarterlySales { Quarter = "2nd", Tokyo = 800, Nagoya = 600, Osaka = 700 });
l.Add(new QuarterlySales { Quarter = "3rd", Tokyo = 600, Nagoya = 400, Osaka = 500 });
l.Add(new QuarterlySales { Quarter = "4th", Tokyo = 900, Nagoya = 500, Osaka = 800 });
this.chart1.DataContext = l;
}
}まとめると、MainPage.xaml.cs は以下のようになる
using System;
using System.Collections.Generic;
using System.Linq;
using System.Net;
using System.Windows;
using System.Windows.Controls;
using System.Windows.Documents;
using System.Windows.Input;
using System.Windows.Media;
using System.Windows.Media.Animation;
using System.Windows.Shapes;
namespace SilverlightApplication1
{
public partial class MainPage : UserControl
{
    public MainPage()
    {
        InitializeComponent();

        List<QuarterlySales> l = new List<QuarterlySales>();
        l.Add(new QuarterlySales { Quarter = "1st", Tokyo = 700, Nagoya = 600, Osaka = 900 });
        l.Add(new QuarterlySales { Quarter = "2nd", Tokyo = 800, Nagoya = 600, Osaka = 700 });
        l.Add(new QuarterlySales { Quarter = "3rd", Tokyo = 600, Nagoya = 400, Osaka = 500 });
        l.Add(new QuarterlySales { Quarter = "4th", Tokyo = 900, Nagoya = 500, Osaka = 800 });

        this.chart1.DataContext = l;
    }
}
public sealed class QuarterlySales
{
public String Quarter { get; set; } //クオーター
public Int32 Tokyo { get; set; } //東京の売上高
public Int32 Nagoya { get; set; } //名古屋の売上高
public Int32 Osaka { get; set; } //大阪の売上高
}
}・今回は、系列が3つあるので、3つのLineSeriesを定義する
・それぞれのLineSeriesのIndependentValueBindingにQuarterlySalesクラスのQuarterプロパティをバインドする
・それぞれのLineSeriesのDependentValueBindingには、それぞれQuarterlySalesクラスのTokyoプロパティ、Nagoyaプロパティ、Osakaプロパティをバインドする
<UserControl x:Class="SilverlightApplication1.MainPage"
    xmlns="http://schemas.microsoft.com/winfx/2006/xaml/presentation"
    xmlns:x="http://schemas.microsoft.com/winfx/2006/xaml"
    xmlns:d="http://schemas.microsoft.com/expression/blend/2008"
    xmlns:mc="http://schemas.openxmlformats.org/markup-compatibility/2006"
    mc:Ignorable="d"
    d:DesignHeight="300" d:DesignWidth="400" xmlns:toolkit="http://schemas.microsoft.com/winfx/2006/xaml/presentation/toolkit">

    <Grid x:Name="LayoutRoot" Background="White">

        <toolkit:Chart Name="chart1" Title="Chart Title">

            <toolkit:LineSeries
                ItemsSource="{Binding}"
                IndependentValueBinding="{Binding Quarter}"
                DependentValueBinding="{Binding Tokyo}"
                Title="東京"/>

            <toolkit:LineSeries
                ItemsSource="{Binding}"
                IndependentValueBinding="{Binding Quarter}"
                DependentValueBinding="{Binding Nagoya}"
                Title="名古屋"/>

            <toolkit:LineSeries
                ItemsSource="{Binding}"
                IndependentValueBinding="{Binding Quarter}"
                DependentValueBinding="{Binding Osaka}"
                Title="大阪"/>

        </toolkit:Chart>

    </Grid>
</UserControl>東京、名古屋、大阪の3つの系列をグラフに表示することができた。
3. 散布図を描く
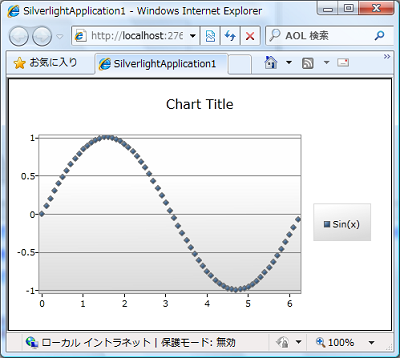
散布図では、高校の数学で習った三角関数のSignカーブを書いてみます。
using System;
using System.Collections.Generic;
using System.Linq;
using System.Net;
using System.Windows;
using System.Windows.Controls;
using System.Windows.Documents;
using System.Windows.Input;
using System.Windows.Media;
using System.Windows.Media.Animation;
using System.Windows.Shapes;

namespace SilverlightApplication1
{
    public partial class MainPage : UserControl
    {
        public MainPage()
        {
            InitializeComponent();

            List<Point> l = new List<Point>();

            // PointオブジェクトのXプロパティはX座標に相当するラジアンを表し、
            //Y座標に相当するYプロパティはSin(x)の値を表す。
            for (Double x = 0; x < 2 * Math.PI; x += 0.1)  // 0.1ラジアン毎にプロットする
            {
                l.Add(new Point { X = x, Y = Math.Sin(x) });
            }

            this.chart1.DataContext = l;
        }
    }
}
<UserControl x:Class="SilverlightApplication1.MainPage"
    xmlns="http://schemas.microsoft.com/winfx/2006/xaml/presentation"
    xmlns:x="http://schemas.microsoft.com/winfx/2006/xaml"
    xmlns:d="http://schemas.microsoft.com/expression/blend/2008"
    xmlns:mc="http://schemas.openxmlformats.org/markup-compatibility/2006"
    mc:Ignorable="d"
    d:DesignHeight="300" d:DesignWidth="400" xmlns:toolkit="http://schemas.microsoft.com/winfx/2006/xaml/presentation/toolkit">

    <Grid x:Name="LayoutRoot" Background="White">

        <toolkit:Chart Name="chart1" Title="Chart Title">

            <toolkit:ScatterSeries
                ItemsSource="{Binding}"
                IndependentValueBinding="{Binding X}"
                DependentValueBinding="{Binding Y}"
                Title="Sin(x)"
                />

        </toolkit:Chart>

    </Grid>
</UserControl>
Signカーブを描くことができた
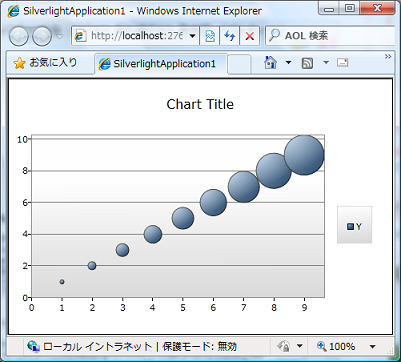
4. バブルチャートを描く
最後は、バブルチャートを書いてみます。今回は、単純に Y = X で表される一次関数の直線をバブルチャートで書いてみます。
using System;
using System.Collections.Generic;
using System.Linq;
using System.Net;
using System.Windows;
using System.Windows.Controls;
using System.Windows.Documents;
using System.Windows.Input;
using System.Windows.Media;
using System.Windows.Media.Animation;
using System.Windows.Shapes;

namespace SilverlightApplication1
{
    public partial class MainPage : UserControl
    {
        public MainPage()
        {
            InitializeComponent();

            //一次関数 Y = X で表される直線
            List<Point> l = new List<Point>();
            for (Double i = 0; i < 10; i++)
            {
                l.Add(new Point { X = i, Y = i });
            }
            this.chart1.DataContext = l;
        }
    }
}
バブルチャートを描くには、BubbleSeries を用いる。 これまでと同様に、IndependentValueBindingにはX軸に相当するPointクラスのXプロパティを、DependentValueBindingには、Y軸に相当するPointクラスのYプロパティをそれぞれバインドする。
<UserControl x:Class="SilverlightApplication1.MainPage"
    xmlns="http://schemas.microsoft.com/winfx/2006/xaml/presentation"
    xmlns:x="http://schemas.microsoft.com/winfx/2006/xaml"
    xmlns:d="http://schemas.microsoft.com/expression/blend/2008"
    xmlns:mc="http://schemas.openxmlformats.org/markup-compatibility/2006"
    mc:Ignorable="d"
    d:DesignHeight="300" d:DesignWidth="400" xmlns:toolkit="http://schemas.microsoft.com/winfx/2006/xaml/presentation/toolkit">

    <Grid x:Name="LayoutRoot" Background="White">
        <toolkit:Chart Name="chart1" Title="Chart Title">

            <toolkit:BubbleSeries
                ItemsSource="{Binding}"
                IndependentValueBinding="{Binding X}"
                DependentValueBinding="{Binding Y}"
                Title="Y"
                />

        </toolkit:Chart>
    </Grid>
</UserControl>