Silverlight4でグラフを描く(縦棒グラフ、横棒グラフ)
Silverlight4とSilverlight4 Toolkitを使って簡単にグラフを描くことができるということで試してみました。
今回は、縦棒グラフと横棒グラフを作成したいと思います。また、Silverlightを用いてグラフを描くのは第1回目なので、Silverlight4 ToolkitのインストールやVisual Studioでの操作なども載せました。
開発環境は、Visual Studio 2010 Ultimate(評価版)です。Silverlight4 SDKなど必要な開発環境はインストール済みのところから開始します。
1.まず、Silverlight4 Toolkitをダウンロードする
1-1. 以下のURLにアクセスし、「Download the latest release」のリンク先URLに移動する
http://silverlight.codeplex.com/
1-2. 「Silverlight4_Toolkit_April_2010.msi」からSilverlight4 Toolkitをダウンロードする
2. Silverlight4 Toolkitをインストールする
3.Visual Studio 2010を起動する
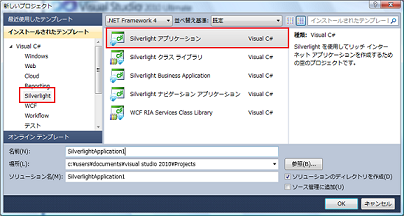
4.「ファイル」→「新規作成」→「プロジェクト」から「Silverlightアプリケーション」プロジェクトを作成する
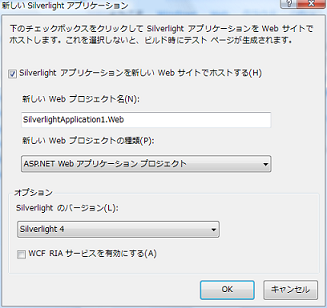
「OK」ボタンで次へ進む
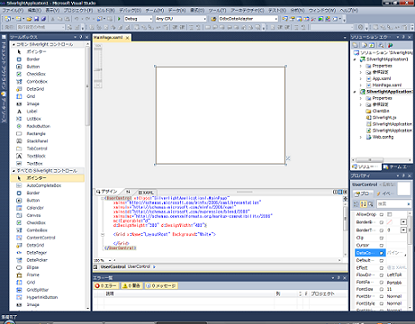
「MainPage.xaml」 が表示される
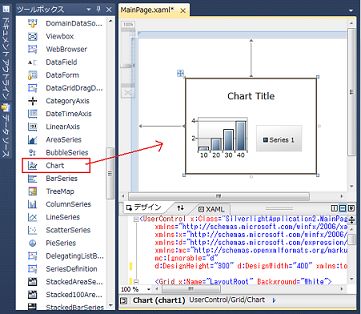
5.ツールボックスから「Chart(チャートコントロール)」を選択し、MainPage.xaml のデザイン用のペイン上にドラッグ・アンド・ドロップで貼り付ける
チャートコントロールを貼り付けた直後のMainPage.xamlは以下のようになる。これから、このXAMLやMainPage.xaml.csのコードを編集して独自のグラフを描いていく
<UserControl x:Class="SilverlightApplication1.MainPage"
    xmlns="http://schemas.microsoft.com/winfx/2006/xaml/presentation"
    xmlns:x="http://schemas.microsoft.com/winfx/2006/xaml"
    xmlns:d="http://schemas.microsoft.com/expression/blend/2008"
    xmlns:mc="http://schemas.openxmlformats.org/markup-compatibility/2006"
    mc:Ignorable="d"
    d:DesignHeight="300" d:DesignWidth="400" xmlns:toolkit="http://schemas.microsoft.com/winfx/2006/xaml/presentation/toolkit">

    <Grid x:Name="LayoutRoot" Background="White">
        <toolkit:Chart HorizontalAlignment="Left" Margin="83,71,0,0" Name="chart1" Title="Chart Title" VerticalAlignment="Top">
            <toolkit:ColumnSeries DependentValuePath="X" IndependentValuePath="Y">
                <toolkit:ColumnSeries.ItemsSource>
                    <PointCollection>
                        <Point>1,10</Point>
                        <Point>2,20</Point>
                        <Point>3,30</Point>
                        <Point>4,40</Point>
                    </PointCollection>
                </toolkit:ColumnSeries.ItemsSource>
            </toolkit:ColumnSeries>
        </toolkit:Chart>
    </Grid>
</UserControl>
6. 縦棒グラフ(ColumnSeries)を描く
例として、テストの教科に対する得点を表す縦棒グラフを描く。
6-1. 以下のような、教科とそれに対するテストの得点を表すデータ構造を「MainPage.xaml.cs」に定義する
//テストの得点を表すクラス
public sealed class TestScore
{
    public String Subject { get; set; } //教科
    public Int32 Score { get; set; }    //得点
}
6-2. MainPageクラスのコンストラクタで、ChartコントロールのDataContextにTestScoreのコレクションを設定する
public partial class MainPage : UserControl
{
    public MainPage()
    {
        InitializeComponent();

        List<TestScore> testScores = new List<TestScore>();
        testScores.Add(new TestScore { Subject = "Japanese", Score = 80 });
        testScores.Add(new TestScore { Subject = "Mathmatics", Score = 70 });
        testScores.Add(new TestScore { Subject = "History", Score = 100 });
        testScores.Add(new TestScore { Subject = "Physics", Score = 90 });
        testScores.Add(new TestScore { Subject = "English", Score = 90 });

        this.chart1.DataContext = testScores;
    }
}
まとめると、「MainPage.xaml.cs」は以下のようになる
using System;
using System.Collections.Generic;
using System.Linq;
using System.Net;
using System.Windows;
using System.Windows.Controls;
using System.Windows.Documents;
using System.Windows.Input;
using System.Windows.Media;
using System.Windows.Media.Animation;
using System.Windows.Shapes;

namespace SilverlightApplication1
{
    public partial class MainPage : UserControl
    {
        public MainPage()
        {
            InitializeComponent();

            List<TestScore> testScores = new List<TestScore>();
            testScores.Add(new TestScore { Subject = "Japanese", Score = 80 });
            testScores.Add(new TestScore { Subject = "Mathmatics", Score = 70 });
            testScores.Add(new TestScore { Subject = "History", Score = 100 });
            testScores.Add(new TestScore { Subject = "Physics", Score = 90 });
            testScores.Add(new TestScore { Subject = "English", Score = 90 });

            this.chart1.DataContext = testScores;
        }
    }

    //テストの得点を表すクラス
    public sealed class TestScore
    {
        public String Subject { get; set; } //教科
        public Int32 Score { get; set; }    //得点
    }
}
7. XAMLでデータバインドの設定を行う
「MainPage.xaml」を以下のように修正し、TestScoreクラスのプロパティをColumnSeriesクラスのプロパティにバインドする。この時、以下の2点に注意する。
<UserControl x:Class="SilverlightApplication1.MainPage"
    xmlns="http://schemas.microsoft.com/winfx/2006/xaml/presentation"
    xmlns:x="http://schemas.microsoft.com/winfx/2006/xaml"
    xmlns:d="http://schemas.microsoft.com/expression/blend/2008"
    xmlns:mc="http://schemas.openxmlformats.org/markup-compatibility/2006"
    mc:Ignorable="d"
    d:DesignHeight="300" d:DesignWidth="400" xmlns:toolkit="http://schemas.microsoft.com/winfx/2006/xaml/presentation/toolkit">

    <Grid x:Name="LayoutRoot" Background="White">

        <toolkit:Chart Name="chart1" Title="Chart Title">
            <toolkit:ColumnSeries ItemsSource="{Binding}"
                                  IndependentValueBinding="{Binding Subject}"
                                  DependentValueBinding="{Binding Score}"
                                  Title="得点">
            </toolkit:ColumnSeries>
        </toolkit:Chart>

    </Grid>
</UserControl>
実行すると、以下のように縦棒グラフが表示される。
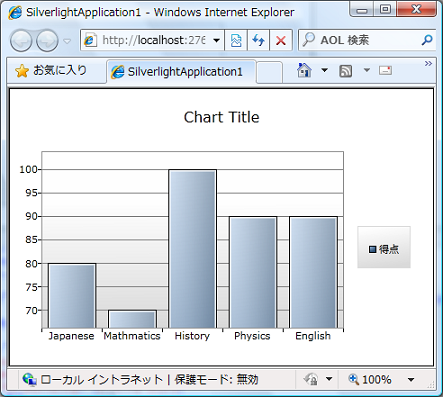
しかし、テストの得点であるからには、0点から100点まで表示したい。そこで、次の手順8を行う。
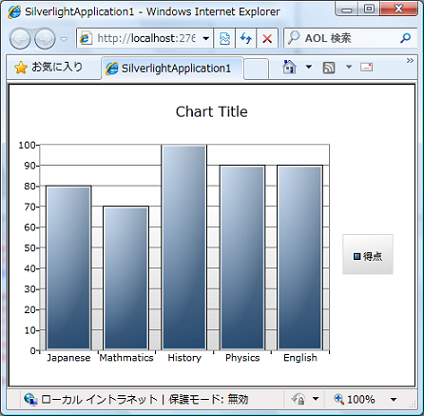
8. Y軸の範囲をXAMLで指定する
<UserControl x:Class="SilverlightApplication1.MainPage"
    xmlns="http://schemas.microsoft.com/winfx/2006/xaml/presentation"
    xmlns:x="http://schemas.microsoft.com/winfx/2006/xaml"
    xmlns:d="http://schemas.microsoft.com/expression/blend/2008"
    xmlns:mc="http://schemas.openxmlformats.org/markup-compatibility/2006"
    mc:Ignorable="d"
    d:DesignHeight="300" d:DesignWidth="400" xmlns:toolkit="http://schemas.microsoft.com/winfx/2006/xaml/presentation/toolkit">

    <Grid x:Name="LayoutRoot" Background="White">
        <toolkit:Chart Name="chart1" Title="Chart Title">
            <toolkit:ColumnSeries ItemsSource="{Binding}"
                                  IndependentValueBinding="{Binding Subject}"
                                  DependentValueBinding="{Binding Score}"
                                  Title="得点">

                <toolkit:ColumnSeries.DependentRangeAxis>
                    <toolkit:LinearAxis Orientation="Y"
                                        Minimum="0"
                                        Maximum="100"
                                        Interval="10"
                                        ShowGridLines="True"
                                        />
                </toolkit:ColumnSeries.DependentRangeAxis>

            </toolkit:ColumnSeries>
        </toolkit:Chart>
    </Grid>
</UserControl>Y軸の範囲が0〜100になり、グリッド線が表示され、10点毎に得点ラベルが表示されていることがわかる。
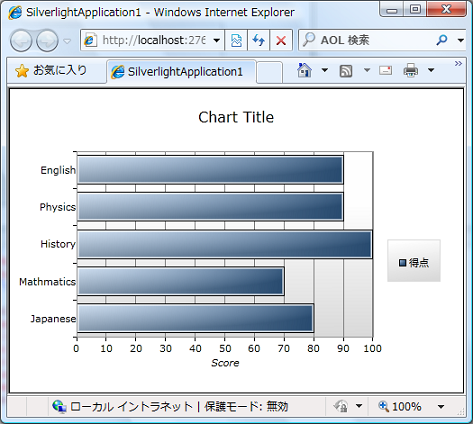
9. 次に上記の縦棒グラフで作成したXAMLをベースにして横棒グラフ(BarSeries)を描く
<UserControl x:Class="SilverlightApplication1.MainPage"
    xmlns="http://schemas.microsoft.com/winfx/2006/xaml/presentation"
    xmlns:x="http://schemas.microsoft.com/winfx/2006/xaml"
    xmlns:d="http://schemas.microsoft.com/expression/blend/2008"
    xmlns:mc="http://schemas.openxmlformats.org/markup-compatibility/2006"
    mc:Ignorable="d"
    d:DesignHeight="300" d:DesignWidth="400" xmlns:toolkit="http://schemas.microsoft.com/winfx/2006/xaml/presentation/toolkit">

    <Grid x:Name="LayoutRoot" Background="White">
        <toolkit:Chart Name="chart1" Title="Chart Title">
            <toolkit:BarSeries ItemsSource="{Binding}"
                               IndependentValueBinding="{Binding Subject}"
                               DependentValueBinding="{Binding Score}"
                               Title="得点">

                <toolkit:BarSeries.DependentRangeAxis>
                    <toolkit:LinearAxis Orientation="X"
                                        Title="Score"
                                        Minimum="0"
                                        Maximum="100"
                                        Interval="10"
                                        ShowGridLines="True" />
                </toolkit:BarSeries.DependentRangeAxis>

            </toolkit:BarSeries>
        </toolkit:Chart>
    </Grid>
</UserControl>
今回は、このあたりで終了したいと思います。


